ODMS : Reports
- Updated on July 27th, 2024
- 58 Minute to read
- Share
-
Dark
1. Quick Overview
Purpose: Reports in the ODMS platform provide a powerful resource for extracting and analyzing data from checklists captured in a restaurant. Various types of reports offer insights into different aspects of restaurant operations, enabling better decision-making and operational efficiency.
Pre-Requisites
Needed Access / Permissions: User access to the ODMS platform.
Pre-setup Requirements: Ensure you are logged into the ODMS platform with your user credentials.
2. Step-by-Step Instructions
Accessing the Reports Page
- Navigate to the ODMS platform and log in using your credentials.
- From the left-hand menu, select “Reports” to open the Reports page.
Understanding the Reports Page
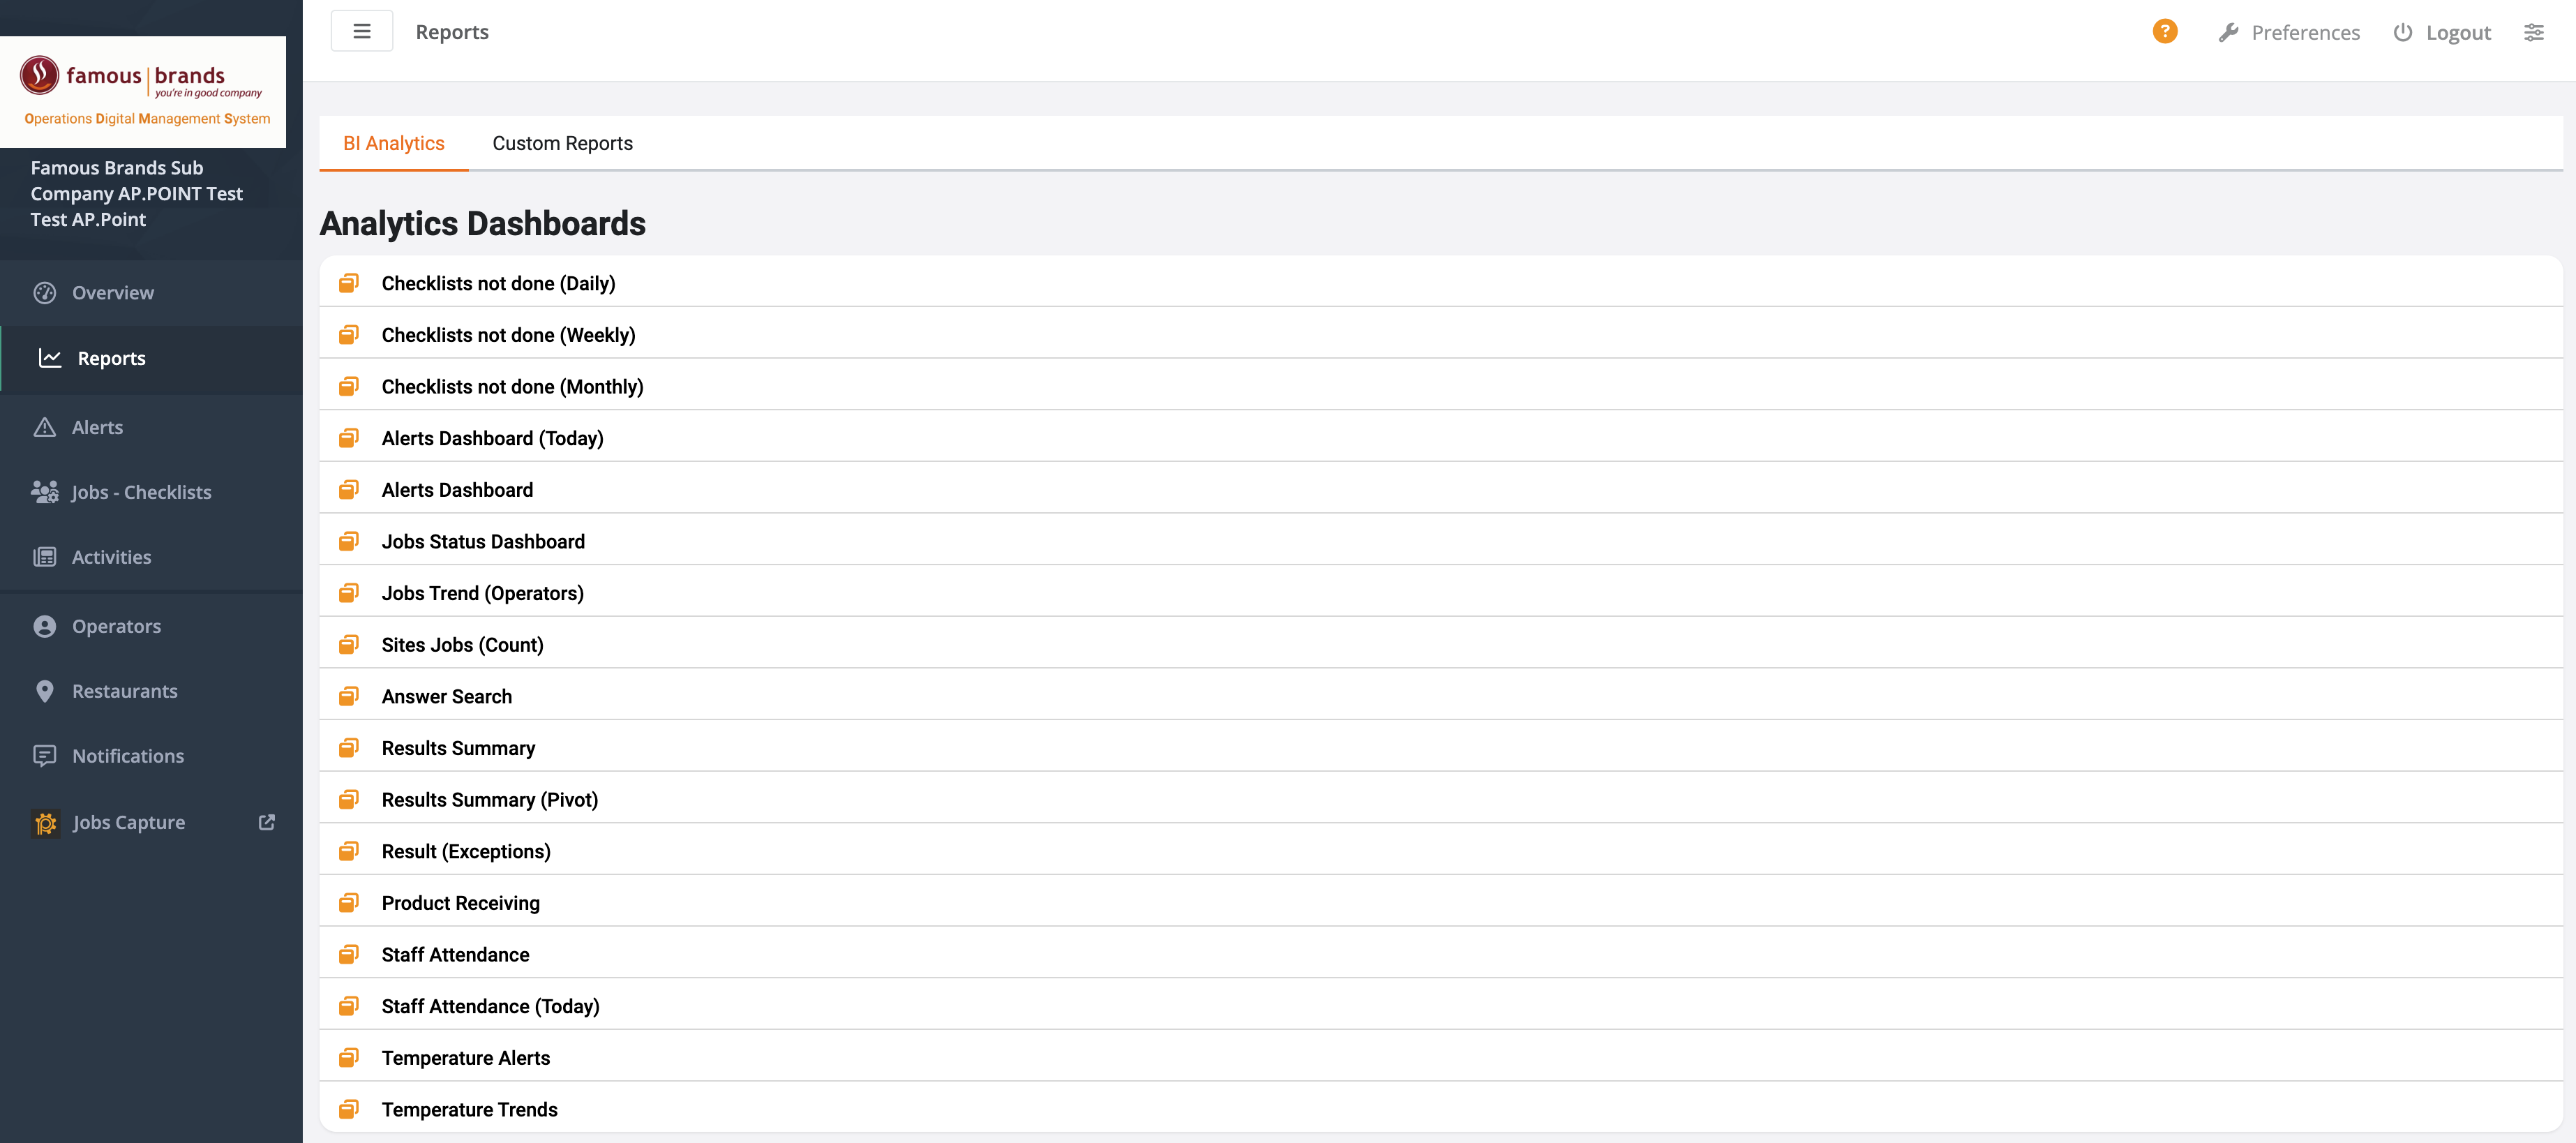
The Reports page is divided into two main tabs: BI Analytics and Custom Reports.
- BI Analytics includes predefined dashboards and reports for quick access to critical data.
- Custom Reports allows you to access customize reports for ODMS.

Types of Reports Available
The following are some of the key dashboards available under BI Analytics:
-
Checklists
- Checklists not done (Daily): Provides a daily summary of checklists that have not been completed.
- Checklists not done (Weekly): Shows a weekly overview of missed checklists.
- Checklists not done (Monthly): Displays monthly data on incomplete checklists.
-
Alerts
- Alerts Dashboard (Today): Highlights alerts for the current day.
- Alerts Dashboard: Provides a broader view of alerts over a selected period.
-
Jobs / Checklists
- Jobs Status Dashboard: Displays the status of various jobs.
- Jobs Trend (Operators): Shows trends in job completion by operators.
- Sites Jobs (Count): Counts the number of jobs performed at different sites.
-
Answer and Results
- Answer Search: Allows searching for specific answers within checklists.
- Results Summary: Provides a summary of checklist results.
- Results Summary (Pivot): A pivot table view of checklist results for detailed analysis.
- Result (Exceptions): Highlights exceptions in checklist results.
-
ODMS Specific
- Product Receiving: Tracks data related to product receiving checklists.
- Staff Attendance: Monitors staff attendance based on checklists.
- Staff Attendance (Today): Provides a snapshot of staff attendance for the current day.
- Temperature Alerts: Shows alerts related to temperature control.
- Temperature Trends: Analyzes trends in temperature data over time.
Generating a Report / BI Analytics Dashboards

To generate a report:
- Click on the new tab icon next to the report name will open the report/dashboard in a new tab
- Click on the desired report name from the list, will open the report in the current page
The report will open, displaying the data in a structured format, such as tables, charts, or graphs.
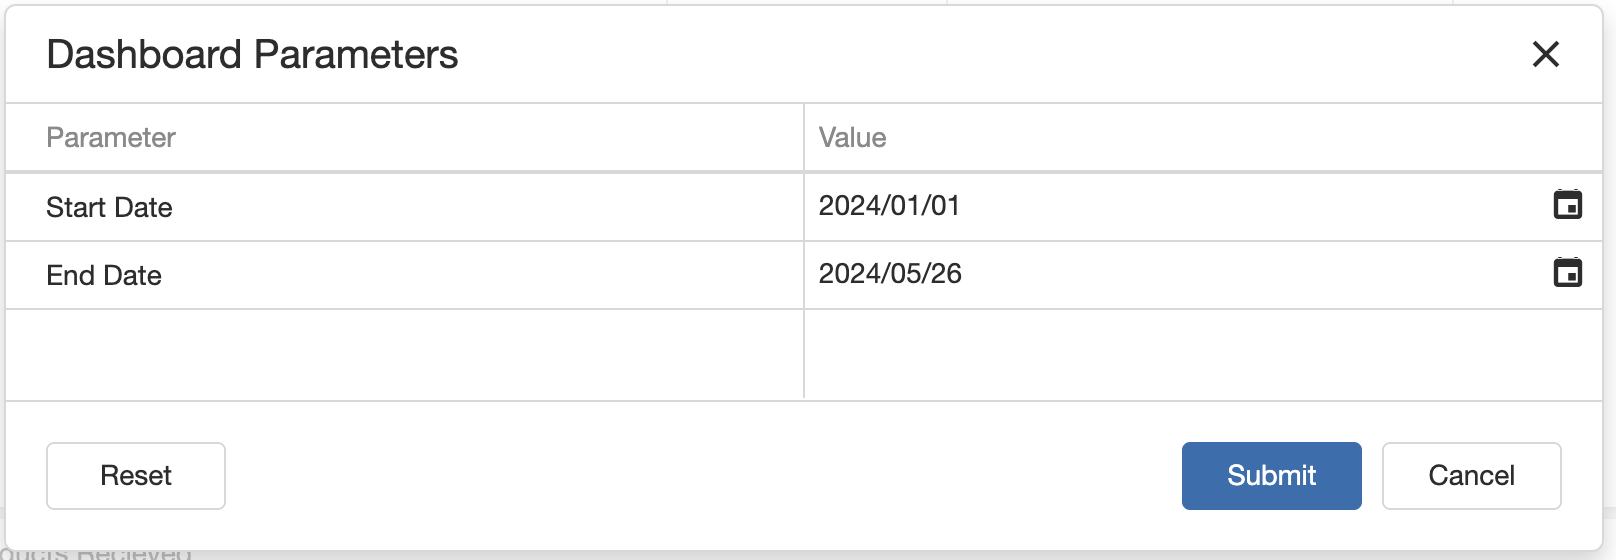
You can customize the report view by applying filters or changing the date range.
Navigating Dashboard Reports

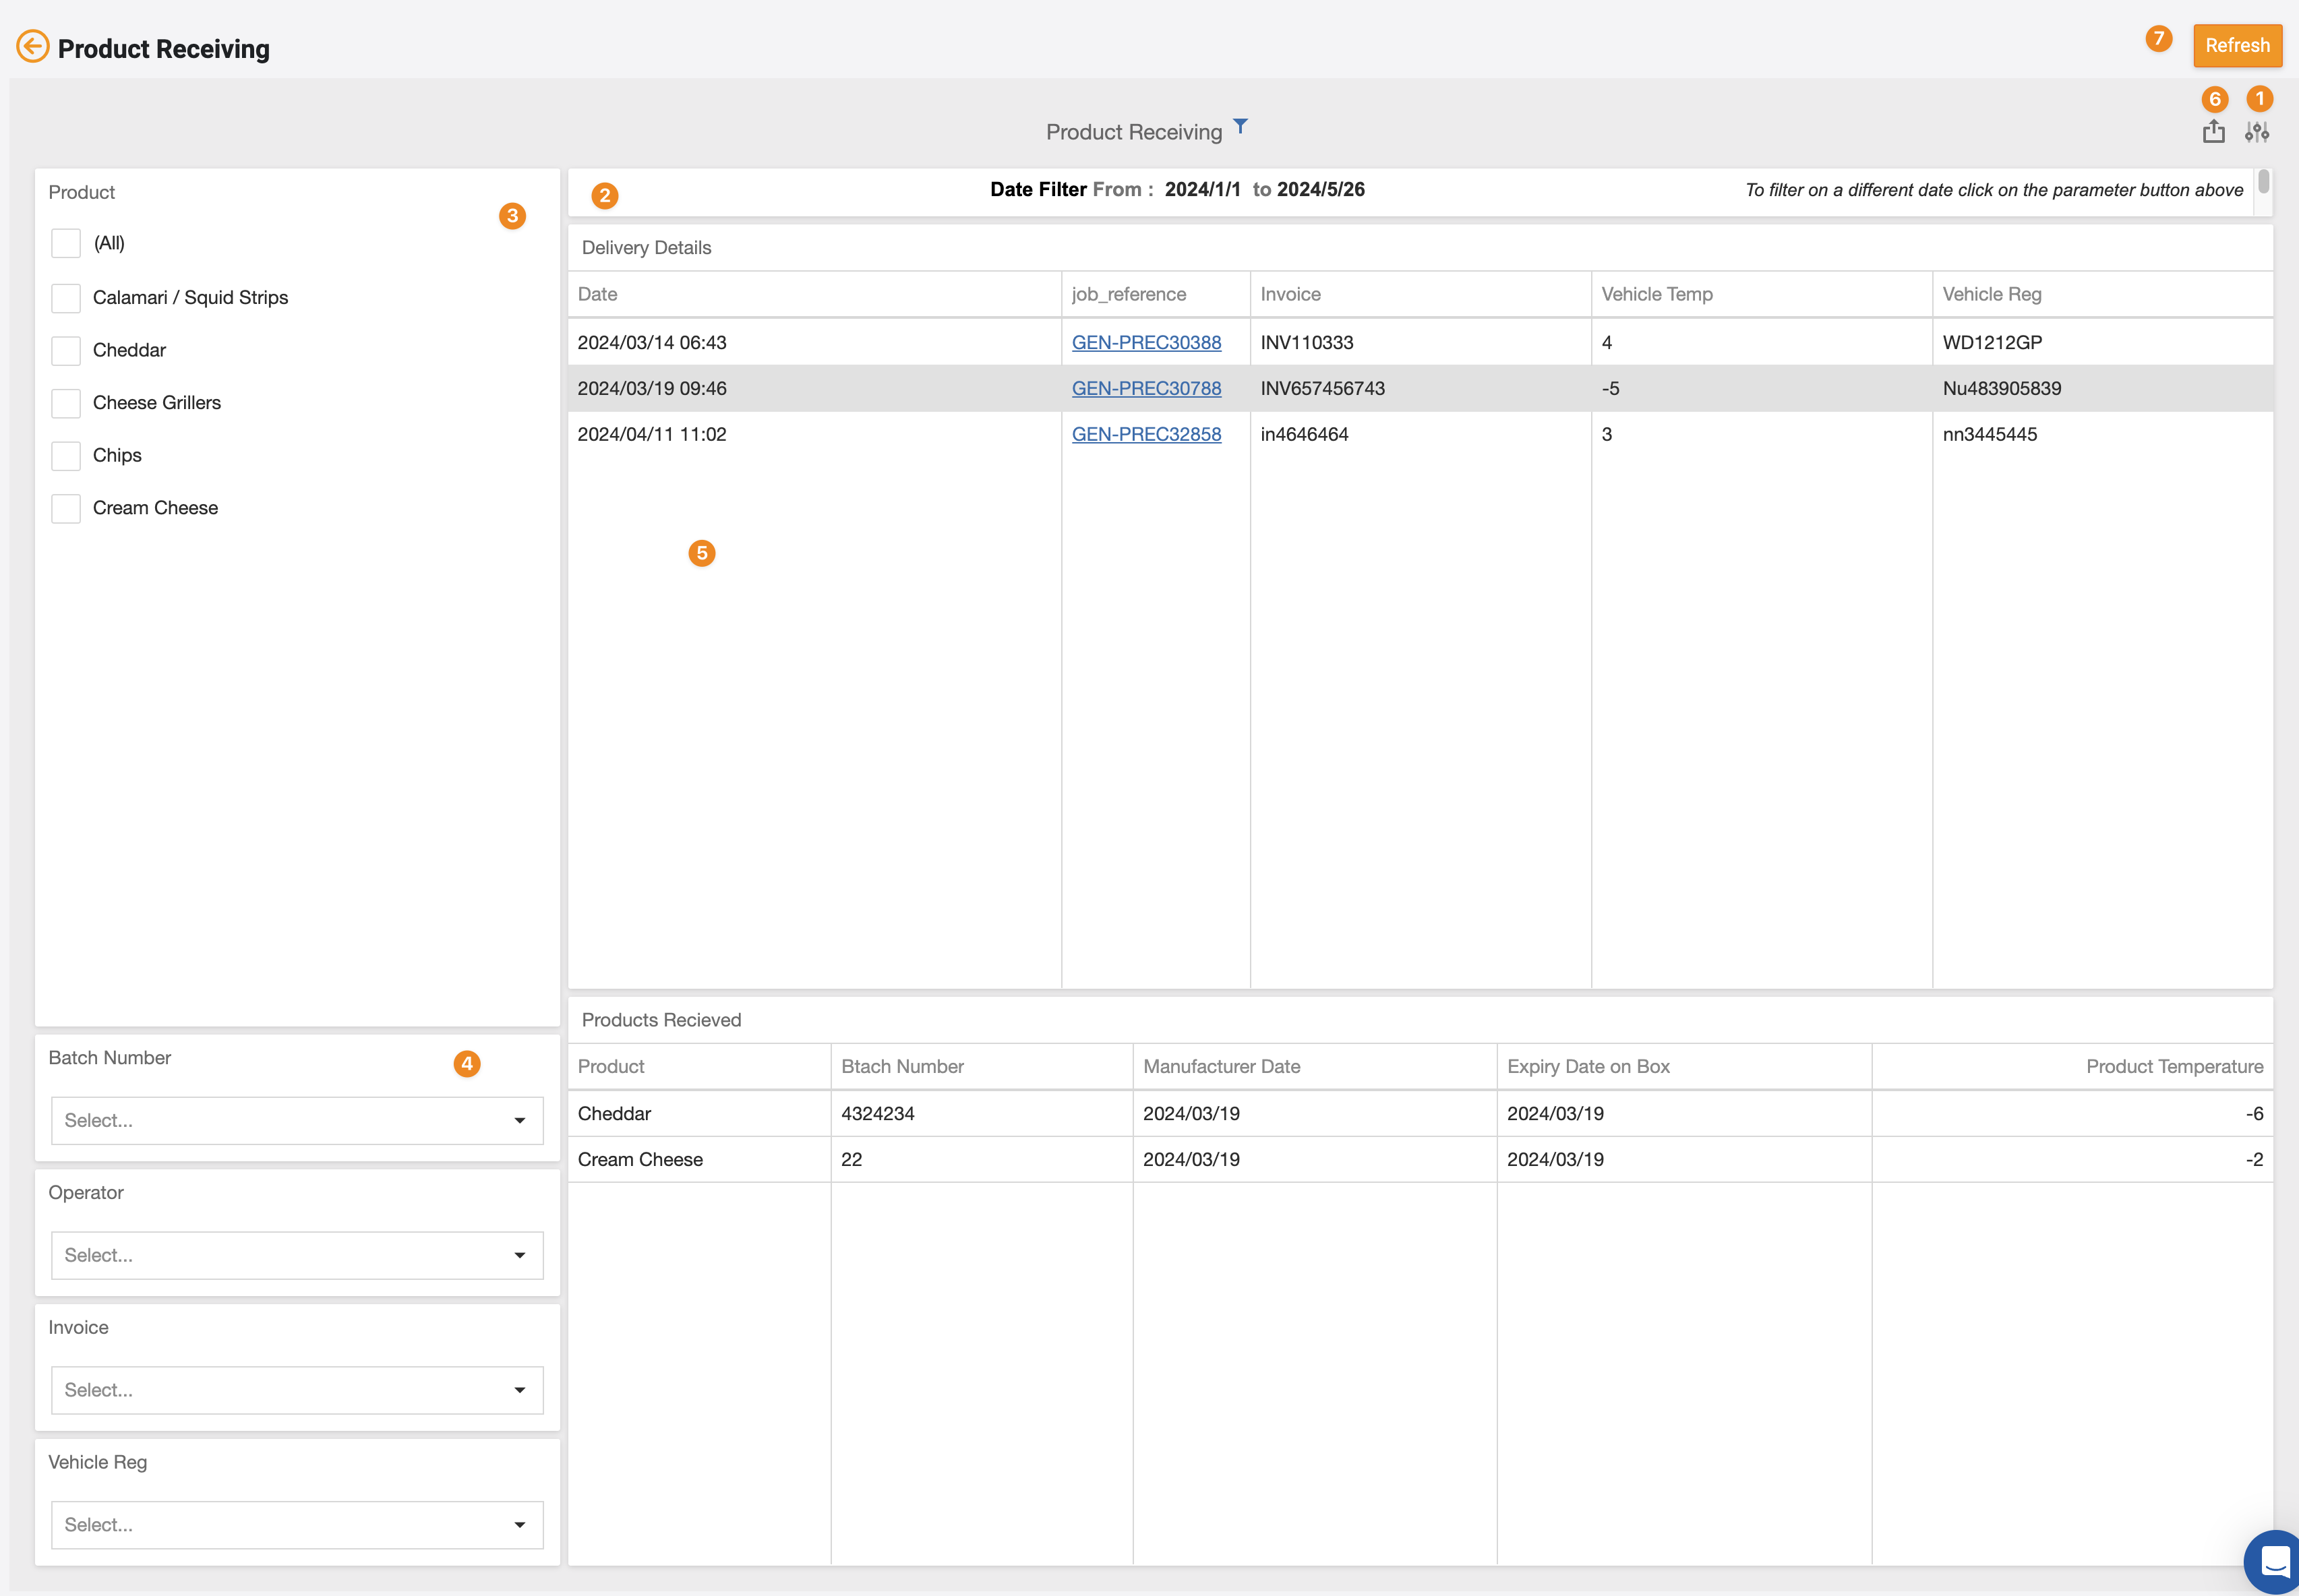
1. Parameter Filter


Purpose: The parameter filter allows you to select from various master filters to load the relevant data.
How to Use: Click on the parameter filter dropdown and choose the desired filter options to narrow down the data displayed on the dashboard.
2. Filter Title
Purpose: Displays the selected parameter filter in the data filter title for easy reference.
How to Use: After selecting the parameter filter, the chosen filters will be displayed in the data filter title area, providing context for the data being viewed.
3. List selector
Purpose: Allows you to filter the dashboard content by selecting multiple items from a list.
How to Use: Check the boxes next to the items you want to include in the filter. This filter supports selecting multiple items simultaneously.
4. Combo selector
Purpose: Enables filtering of the dashboard content by selecting a single item from a list.
How to Use: Click on the combo filter dropdown and select one item from the list to apply the filter.
5. Grid
Purpose: Displays data in a grid format, allowing for sorting and detailed viewing.
How to Use: Click on the column headers to sort the data in ascending or descending order. If text is highlighted as a link, clicking on it will navigate you to the detailed view of the job or checklist.
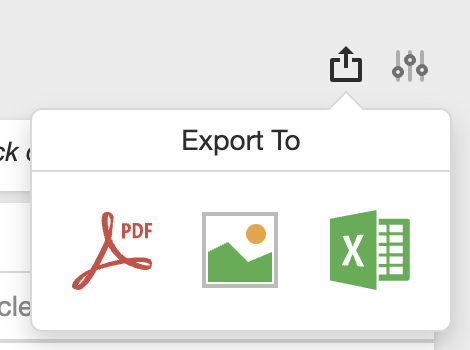
6. Exporting

Purpose: Allows exporting of reports to various formats such as:
- Image: PNG, GIF or JPG
- Excel: XLS or XLSX
How to Use: Click on the export button and choose the desired format to download the report.
7. Refresh

Purpose: Refreshes the data to ensure you have the latest updates.
How to Use: Click the refresh button to reload the data on the dashboard.
3. Tips and Tricks
Best Practices: Double-check all job details before finalizing to avoid errors in allocation.
Common Issues and Fixes:
If a job is not allocated correctly, review the checklist and operator selection.
Additional Resources
- For more information on using Opus for task management, refer to the Opus user manual or help documentation.